

Bollinger Bands are one of the most widely known and versatile technical indicators ever developed. Two of the most common ways traders use them are to help identify when an existing trend may be overextended and when a short-term reversal may be imminent.
Indicator Characteristics
Bollinger Bands measure volatility, how quickly and far price action will potentially move up and down, by creating bands above and below the Moving Average that expand and contract as volatility increases and decreases. This is accomplished by using the trading range in which the security has moved in the form of a standard deviation calculation. Standard deviation measures how far each individual data point varies from the average for all of the data points. By utilizing price volatility, Bollinger Bands adjust automatically to market conditions. As price gets more volatile, the bands widen (move further away from the average), and during less volatile periods, the bands contract (move closer to the average). 1. Band Touches - Some traders consider a touch or "tag" of the upper band a signal that price is "overbought" and tag of the lower a signal that price is "oversold.". A touch of the lower band can be considered a sign of a potential oversold market and that a bounce in price may be due. One way to improve the usefulness of an oversold signal is to give consideration to the overall price trend for the stock or asset in question, and to focus on trading in the direction of the overall trend. For example, if a stock is deemed to be in a longer-term uptrend, a trader may focus on trying to buy the stock when price dips down to the lower Bollinger Band, and selling when price returns to the 20-day middle moving average. A touch of the upper band can be considered a sign of a potential overbought market and that a pullback in price may be due. One way to improve the usefulness of an overbought signal is to give consideration to the overall price trend for the stock or asset in question, and to focus on trading in the direction of the overall trend. For example, if a stock is deemed to be in a longer-term downtrend, a trader might focus on trying to short the stock when price moves up to the upper Bollinger Band, and buying back when price returns to the 20-day middle moving average. Volatility is considered by many traders to be mean reverting; in other words periods of low volatility are often followed by periods of high volatility and vice versa. When volatility decreases significantly, the Bollinger Bands narrow around the stock or asset, a condition often called the Bollinger Band Squeeze. This tightening of the bands suggests that there is increasing potential for a large move when volatility reverts to more normal levels. It is important to note that the bands are not giving any indication of the direction of the potential move, but only that an increase in the rate of price movement may be imminent. The ability to self-adjust to market volatility and to give insight into potential overbought or oversold conditions make Bollinger Bands a truly versatile indicator. However, as with any particular technical indicator, most technical analysts would agree that one should not rely on a single indicator to make any investment decision. Important Disclosures Schwab does not recommend the use of technical analysis as a sole means of investment research.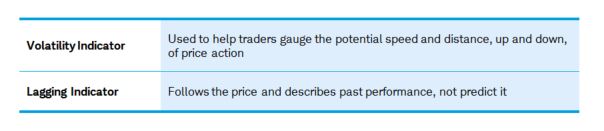
Bollinger Bands use the 20-period moving average line as the center "baseline." The upper band is set two standard deviations above the baseline and the lower band two standard deviations below.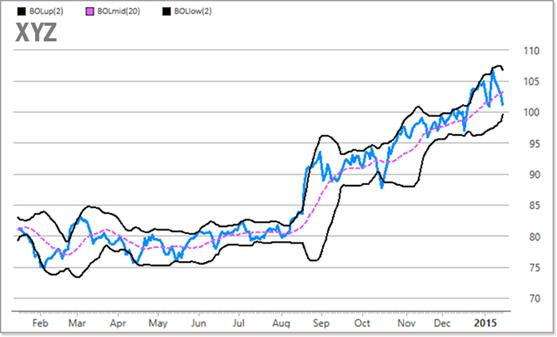
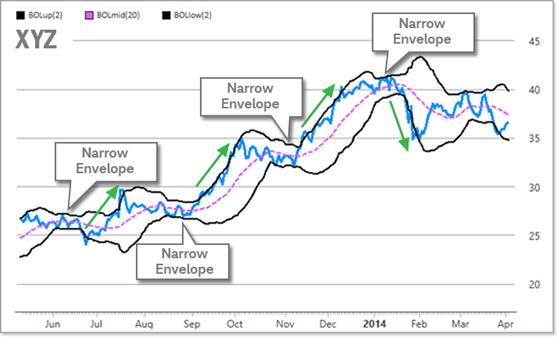
2. Width of Envelope - How wide or close together the bands are can be an early indication of potential changes in volatility.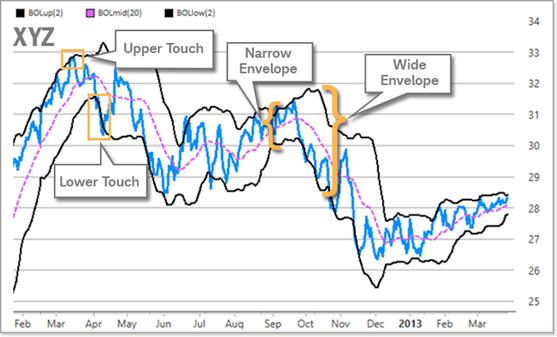
For example, if a stock is trading above its 200-day moving average, a trader might consider buying when the price "tags" the lower Bollinger Band, and selling when the price returns to the 20-day moving average.
For example, if a stock is trading below its 200-day moving average, a trader might consider shorting when price "tags" the upper Bollinger Band and covering when price returns to the 20-day moving average.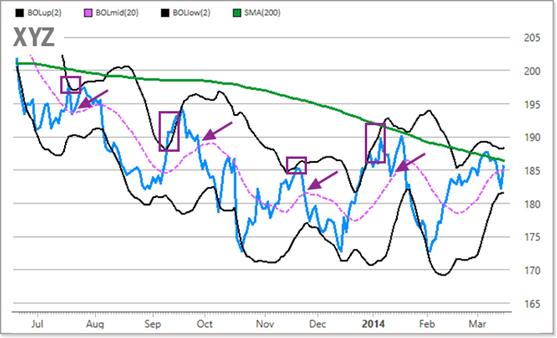
The information here is for general informational purposes only and should not be considered an individualized recommendation or endorsement of any particular security, chart pattern or investment strategy.
Past performance is no guarantee of future results.